|
Did someone forward this email to you? Sign up here
|
8th June 2021
Client Briefing |
|
Hi ,
In this edition we are looking in detail at market activity for May and we continue to record a similar theme with a strong seller’s market constrained and underpinned by the imbalance with supply failing to keep pace. We have produced a comparison to 2019 as the most recent year where the pandemic disruption had not affected the market.
We have looked in more detail at the postcode areas where there is the greatest impact with a high velocity in transaction volumes and time on market and contrasted this with what is happening in our capital city.
Overall, this is a very positive market for agents and associated professionals but there is also a sustainability concern very evident in the overall numbers and direction of travel.
|
All the best and stay safe and well,
Ian Lancaster
CEO TwentyCi Group
|
|
The Headlines
|
|
| • | May 2021 continued to have an extraordinarily high demand for property
- Over 148k sales were agreed in the month and this is 29% up on 2019
- Demand for property in May remains higher than supply
- 30% of newly listed property in 2021 sells inside 2 weeks
| | • | Scotland is the UK region where property is selling fastest in 2021
- Where a whopping 44% of new property listed sells inside 2 weeks
| | • | London is the UK region where property is selling slowest in 2021
- In Inner London, only 11% of new property listed sells inside 2 weeks
| |
|
It always amazes me how the end of May comes around so quickly as each year passes. At time of writing, May 2021 was set to be the wettest May since records began, even though it ended with a small number of hot sunny days.
Demand in the property market however was in no way dampened by the weather, in fact the market is still racing ahead at a significant pace.
In this edition, we update you on demand and supply factors and also highlight some informative statistics on which areas are selling well.
|
|
2021 Supply Volumes versus 2019 |
Regular readers will already know that TwentyCi measure supply in the housing market by focusing on the volume of New Instructions, which are people putting their house up for sale with an Estate Agent.
We can’t really compare 2021 to 2020, because of the pandemic, but it is helpful to compare 2021 to a 2019 norm. The following chart compares supply volumes in 2021 by month with 2019.
|
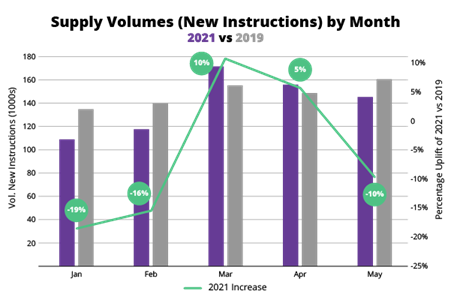 |
Note that we have also added a green line which plots the percentage increase / decrease from two years ago.
Overall, supply volumes in 2021 to-date are 6% down on 2019. There was some good news in March and April of this year, where supply volumes exceeded the 2019 norm, but in May, volumes were 10% lower than what one might expect for the time of year.
In total in May 2021, TwentyCi observed nearly 146k New Instructions.
|
|
2021 Demand Volumes versus 2019 |
Again, regular readers will already know that TwentyCi measure demand in the housing market by focusing on the volume of Sales Agreed on properties which are on the market.
The following chart updates us on demand volumes in 2021 by month and compares this with 2019.
|
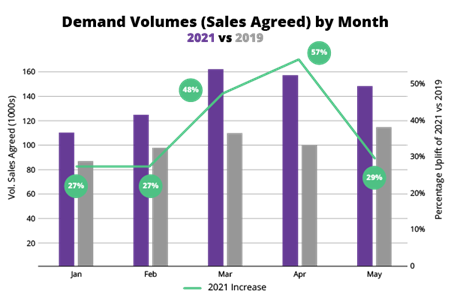 |
The striking thing about the chart is that we can observe that every month thus far in 2021 has levels of demand that far exceed 2019’s norm. May was no exception to this rule as TwentyCi observed over 148k Sales Agreed in the month.
A look at the green line, measuring the percentage increase in sales over 2019 does suggest that May saw a slight cooling off compared with March and April. But this is still a 29% increase in sales agreed compared to 2019 norms and the period continues to be unprecedented within our data sets which go back to 2008.
|
|
Selling Fast! |
In the whole of 2019, about 15% of properties that were newly listed for sale sold inside the first 2 weeks. Thus far in 2021, that average is now 30%.
Let’s drill down on this factor and assess where in the UK properties are selling fastest by measuring the percentage of newly listed properties that sell in 2 weeks. The following table highlights this at a regional level.
|
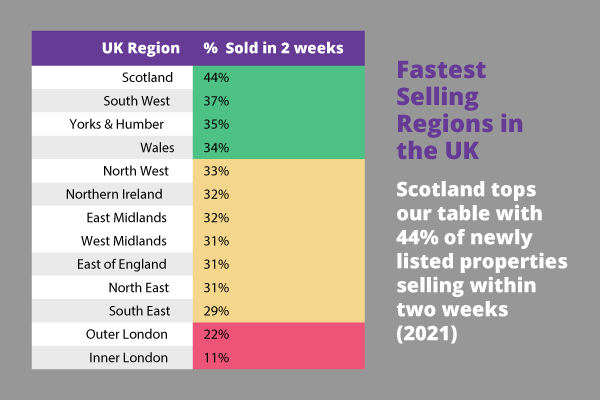 |
Since 2021 started, Scotland tops our table of properties selling fastest, where a massive 44% of all properties listed sell in 2 weeks. We also observed quick sales in the South West, Yorkshire, Wales and the North West.
Property newly instructed in London however is not selling fast at the minute. Ironically, in Q4 2020, London property was selling faster than average at that time, but since the start of 2021, this is no longer the case.
Drilling down on this to the next level, here are the top 10 postcode areas based on the percentage of new instructions that sell in two weeks…
|
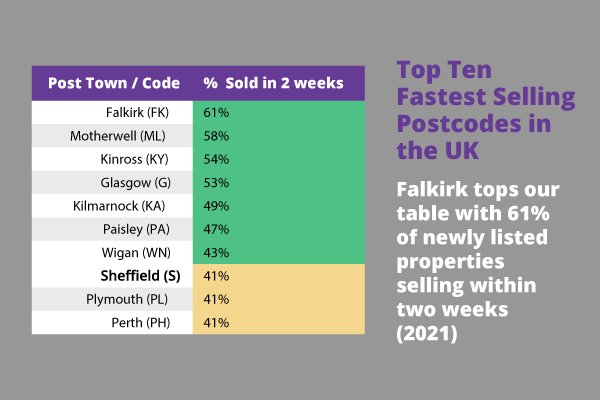 |
Falkirk tops our table of the places in the UK where newly instructed property sells fastest, with 61% of all instructions selling inside 2 weeks. Note that 7 out of the top 10 are in Scotland and only 1 area is in The South.
When we look at the other end of the scale, 8 out of 10 of the slowest selling properties are in London.
|
|
Comment |
2021 has seen record levels of demand that we have not witnessed before and overall, newly listed property is selling fast.
There is, as we have seen, a small amount of evidence that the market is just starting to cool off, but we should not let this overshadow the news that May was still c30% ahead of 2019 norms.
As we have stated previously, the issue that remains is a distinct lack of supply as you will note that demand volumes in the form of Sales Agreed at a national level once again eclipsed supply volumes in the form of new property coming to the market.
Readers should expect even further asking and selling price rises in the short term, especially in the “hotter” areas where property is selling fast, as the inevitable market correction between supply and demand happens.
These client briefings are not intended as sales communications, but if you would like to know more about what is happening in the property market then please contact Katy Billany, (Our Executive Director for Estate Agency Services) here - katy.billany@twentyci.co.uk.
|
|
Did someone forward this email to you? Sign up here
|