…and could you wait a whole year to find out? If you need this information to make decisions about your business, probably not...
Working alongside TwentyEA, a market intelligence agency for property professionals, it’s imperative that I have access to real time, accurate data in relation to the UK’s housing market.
There are lots of sensational articles around at the moment claiming the number of properties sold in the UK is down year on year from anywhere between 3% and 12%. Most of these articles rely on published data from either HM Land Registry or HM Revenue & Customs, but both organisations point out that sales numbers are provisional on release and should not be looked upon too closely on a month by month basis.
Be wary that the figures from both authorities can be inaccurate when they are first released, and in many cases way beyond the first release!
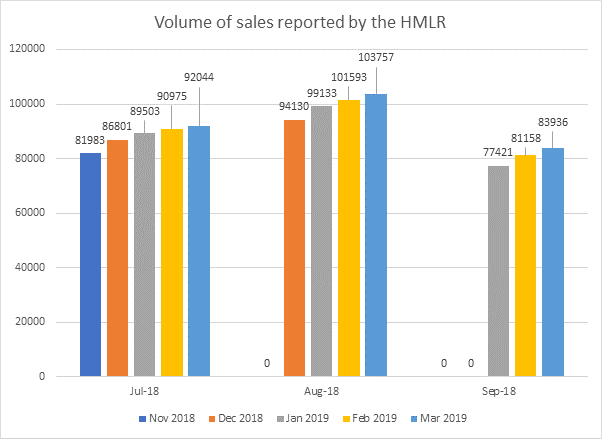
To illustrate how misleading this can be, TwentyEA looked at the number of sales HMLR reported in July, August and September 2018. The graph below shows how the number reported for those months changed towards the end of 2018 through to March 2019.

In November 2018, the HMLR reported 81,983 sales for July that year. In March 2019 July’s number of reported sales had increased to 92,044 (a rise of nearly 12%). You can also see similar increase patterns in August and September.
So, who knows whether property sales in the UK are up, down or stationary when the two data authorities property professionals rely on are clearly inaccurate and lead to misleading results?
The property industry depends on accurate data to make vital business decisions. Fortunately, by considering multiple sources it’s possible to track property exchanges in the UK on a month by month basis.
Sign up to TwentyEA Insight for free local market intelligence to see what’s happening in your area, now.


