We are now at the mid-point between the re-opening of the property market and the end of the year. The surge of new Instructions & sales agreed continues, driving momentum significantly above 2019 norms. Whilst there is lag in exchanges, as a by-product of lockdown, the charts below highlight significant optimism.
Key info:
- 170,000 New Instructions lost due to the “Cost of Covid”.
- 285,000 New Instructions lost during lockdown.
- 115,000 New Instructions gained post lockdown to date.
- 120,000 Sales Agreed lost due to the “Cost of Covid”.
- 238,000 Sales Agreed lost during lockdown.
- 118,000 Sales Agreed gained post lockdown to date.
- 114,000 Exchanges lost due to the “Cost of Covid”.
- 59,000 Sales Agreed lost during lockdown.
- 55,000 Sales Agreed lost post lockdown to date.
- Continued high levels of sales agreed suggests an upcoming surge in property exchanges during the remainder of 2020.
Previously, we measured the cost of Covid to the volume of New Instructions, Sales Agreed and Exchanges, To do this, we looked at the average volumes pre and post Covid, using these averages we were able to calculate the expected volumes during lockdown and compare that against lockdown’s actual performance.
New Instructions in 2020
As a quick recap, here is how the volume of New Instructions has performed so far in 2020. We saw a deficit of 285,000 instructions compared to expected levels without the Covid disruption. Volumes recovered to pre-lockdown levels w/c 15th June and have continued at inflated volumes in more recent weeks.
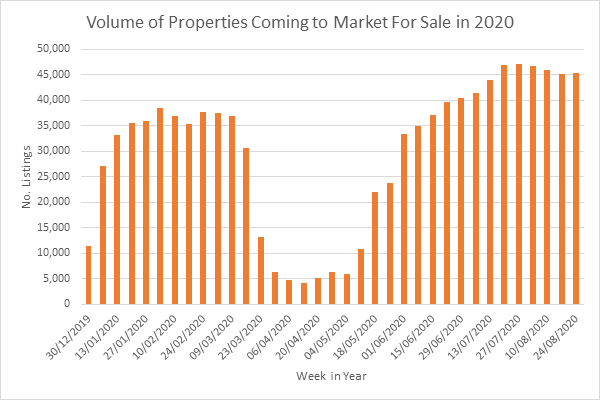
In 2019, despite some volatility in weeks 15 – 23, nationwide levels of instructions were relatively steady at around 35,000 per weeks.
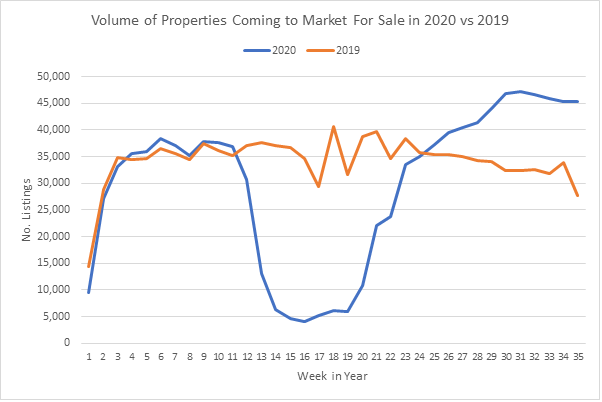
Initially instructions in 2020 followed a similar pattern to 2019 with a slight increase which was credited to the ‘Boris Bounce’. Then during lockdown, instructions fell through the floor but what piqued our interest is the inflated levels we are now observing since w/c 15th June.
In the last 11 weeks, we have seen 115,000 more instructions compared to the same period last year. Whilst this doesn’t make up for the 285,000 lost during lockdown, it is a significant resurgence and with 4 more months left of the year, it is possible that Covid’s impact may be much lower than originally forecasted.
Sales Agreed in 2020
Similarly, to the volume of New Instructions, Sales Agreed saw a big deficit of 238,000 but again volumes quickly recovered.
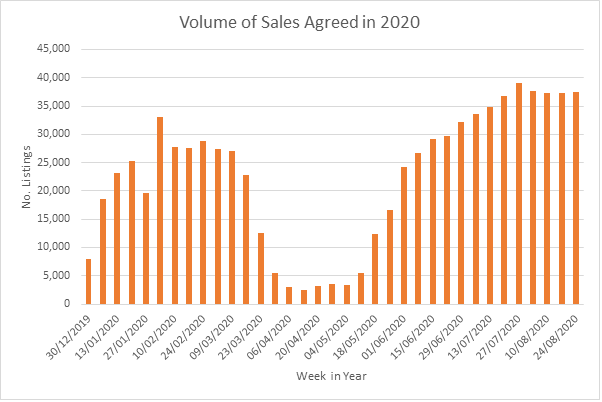
In 2019, nationwide levels were also relatively steady at around 35,000 per week.
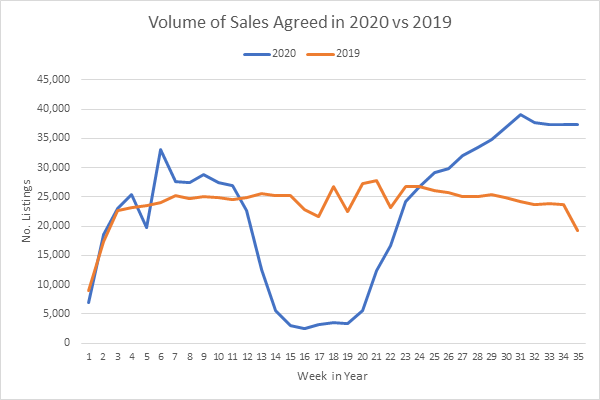
In an identical fashion to what we have already seen with instructions, Sales Agreed began to rise following the re-opening of the Estate Agency market and returned back to pre-lockdown levels w/c 15th June.
In the last 11 weeks we have seen 118,000 more Sales Agreed compared to the same period last a year which again puts a nice dent in the 238,000 lost during lockdown. Let’s see what the next 4 months brings us!
Exchanges in 2020
For exchanges, we calculated a deficit of 59,000. As you can see below, Exchanges recovered to pre-lockdown level much quicker than instructions and sales agreed. However, unlike instructions and sales agreed, exchanges have actually receded a second time, and in the last 3 weeks it is almost at the same levels as it was during lockdown. This also goes against seasonality trends where exchanges usually increase in the summer months.
In reality, the second lull is caused by the lack of sales agreed in March – May. On average it takes 3-4 months for a property transaction to complete and we are now seeing the impact of this disruption.
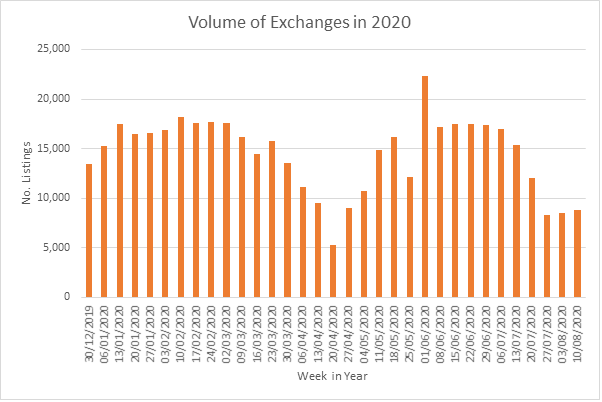
In 2019, nationwide levels of exchanges are not smooth, however there is a definite increase in activity in the summer months through to the end of the year which is a common trend historically.
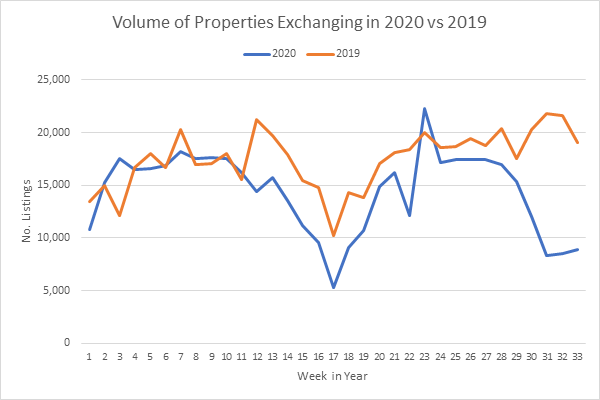
Since lockdown (week 12), exchanges have been tracking at lower level than 2019 and except for week 23 it has remained at lower levels. We do, however, expect to see larger volumes of exchanges in the coming months as the aforementioned inflated volume of sales greed properties begin to cascade through to completion.
In the last 11 weeks we have seen a deficit of 55,000 exchanges compared to the same period last year, coupled with the 59,000 lost during lockdown, exchanges are down 114,000 so far.


