

One Month on from Stamp Duty Holiday End
One month on from the changes to Stamp Duty relief, we wanted to assess what happened in the property market during July 2021.
We set out to answer the following questions:
- To what extent have the high levels of demand that we have experienced since July 2020 subsided?
- Is the supply of property for sale to the housing market continuing to wane?
- What significant changes have occurred in the last month on property asking prices?
- How do the changes to demand, supply and pricing compare to what we’ve seen in the last “normal” year (2019)?
How do we Measure Property Supply & Demand?
To put this into context, it’s useful to understand our means of measuring.
Supply: is measured by the volume of new instructions (people putting their house up for sale with an estate agent).
Demand: is measured using the volume of sales agreed across the UK property market.
Prices: measured using the initial asking prices of property listed for sale.
Property Supply & Demand: July 2021 vs June 2021
So far, the effects of the Stamp Duty holiday ending are minimal.
- Demand is down 2% since June 2021
- Supply is down 4% since June 2021
- Average asking prices have fallen 3% since June 2021
As we use the mean average for house prices, this fall is more likely to be a reflection on the housing mix that’s currently on sale. As a larger quantity of lower priced houses come on to the market this reduces the mean. In contrast, median house prices showed 0% change month on month.
In short, there’s still no sign of the predicted property market crash.
Property Supply & Demand: July 2021 vs July 2019
As the last ‘normal’ year we have on record, the telling comparison is when we measure the figures against 2019.
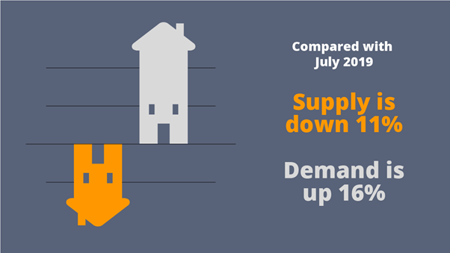
- Demand was up 16% compared with July 2019
- Supply was down 11% compared with July 2019
The following chart looks at the changes in supply and demand metrics by UK region:
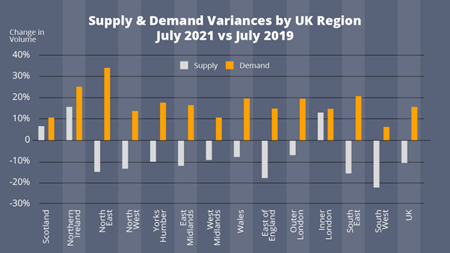
Property supply volumes have fallen in every UK region except London, Scotland and Northern Ireland.
Demand has risen in every region of the UK.
In a normal market, we typically observe levels of demand at around 75% of supply volumes. In July 2021, this is 95%.
Property Supply & Demand: July 2021 vs July 2019
We discussed the UK property shortage at length earlier this year, and our recent analysis suggests this problem is only intensifying. Without a fresh supply of stock at sustainable levels, the property market will begin to break down. House prices will increase further as buying a home becomes even more competitive.
In the market today, houses are selling in record time and it really is a seller’s market. It’s a very challenging time for buyers, and for Estate Agents too. Since the start of July, our analysis has shown that the market share of instructions has risen in lower priced properties that have a less affluent demographic. Leveraging this information, as well as actively encouraging those most likely to instruct will be important steps in helping to alleviate this current challenge.
For more information, or to learn more about our property market insights, then please contact Katy Billany, (Our Executive Director for Estate Agency Services) at katy.billany@twentyea.co.uk.


