

We recently discussed the possibility of September 2021 seeing the highest volume of UK property transactions ever. But after this storm, what comes next? What do the initial trends show us about the UK property market for the rest of 2021, and even into 2022?
Historical trends and current demand levels can give us a telling insight into the future of the UK property market. Let’s take a look at what they’re suggesting so far.
The 2016 Stamp Duty Surcharge: What Happened?
The last significant change to Stamp Duty Land Tax prior to 2020 was made on 1st April 2016. This was the additional surcharge to second-home owners, landlords of buy-to-let properties, and properties purchased under a company.
Such a change is bound to have a significant effect. In 2016 we saw a surge of completions before the deadline. This was followed by a lull in the ensuing months.
The chart below illustrates the phenomenal spike in property transactions in March 2016. This was caused by home buyers, estate agents and conveyancers working hard to complete transactions prior to the deadline. In stark comparison, April 2016 was an underperforming month. Transactions for the month would have been expected to exceed 80,000, yet they did not.
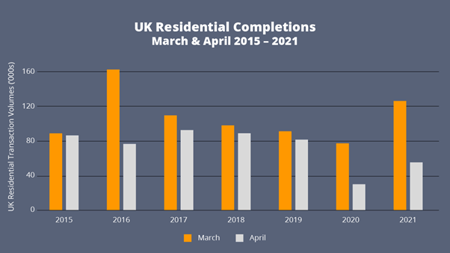
Please note: 2021 numbers are provisional and under-represented. We frequently see increments up to 12 months post the completion from HM Land Registry. Also, note that transactions in April 2020 are significantly impacted by the announcement of the national lockdown on 23rd March 2020.
The UK Property Market Today: Supply
The volume of new instructions coming to market over the last 3 months is on a downward trajectory.
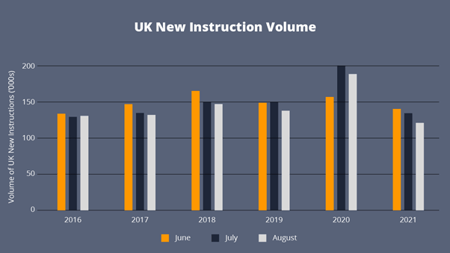
We can see a similar trend in 2017, 2018 and 2019, suggesting that this is typical for this time of year. However, 2021 shows more momentum in its decline. August instructions are the lowest for over 6 years. So the supply shortage continues, but what about demand?
The UK Property Market Today: Demand
Property demand, as measured by sales agreed, has reached record highs in recent months. However, there are signs that this is starting to restore to normal levels. Since March 2021 the volume of sales agreed has been gradually reducing. This provides an indication of future transaction levels as these property purchases complete.
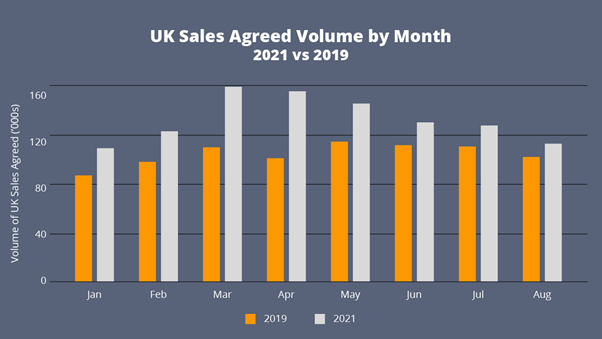
This chart shows the ‘uplift’ in 2021 demand levels compared to the last ‘normal year (2019). The peak in March 2021 is easy to see, followed by a steady decline. Although the latest figures show August 2021 is still 11% up on 2019, the trajectory of sales agreed is falling at a faster rate than 2019.
As a comparison:
- August 2021 volume is 29% down on March 2021
- August 2019 volume is 7% down on March 2019
What Does This Mean for UK Homemovers in 2021 - 2022?
After a surge of completions in September, new instructions and sales agreed are tapering off. This is what we’d expect to see based on similar events in the past, and current supply and demand figures back this up. With all this in mind, we anticipate a smaller pool of homemovers completing their transactions in the final quarter of this year.
For more information, or to learn more about our property market insights, then please contact Katy Billany, (Our Executive Director for Estate Agency Services) at katy.billany@twentyea.co.uk.


